
|

|

|
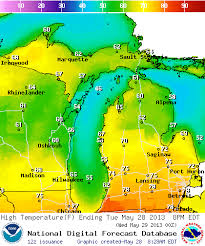
Graphing Michigan's Weather!

Happy "Hour of Code" week!!

|

|


|

|

|

|
Halloween Fun!
|

|
Lesson 3
Microsoft Excel: Graphing our activities in a 24 hour time period
Students will be using Microsoft Excel to create a chart, and graph, using all the activities they do in a 24 hour time period. Students will have to use computer skills, as well as math skills to complete this tasks!
Students will be using Microsoft Excel to create a chart, and graph, using all the activities they do in a 24 hour time period. Students will have to use computer skills, as well as math skills to complete this tasks!
Lesson 2
Using Microsoft Excel, students will be given different writing prompts. Students will be able to change the color, font, and size of their work when they have completed the writing portion of the assignment. Students will also demonstrate how to change to page layout, and margin size of their paper.
Lesson 1- Learning the keyboard